
Tools · Eqora guide
Graph equations with AI to see what the algebra means
When a picture of the function makes the next homework step obvious.
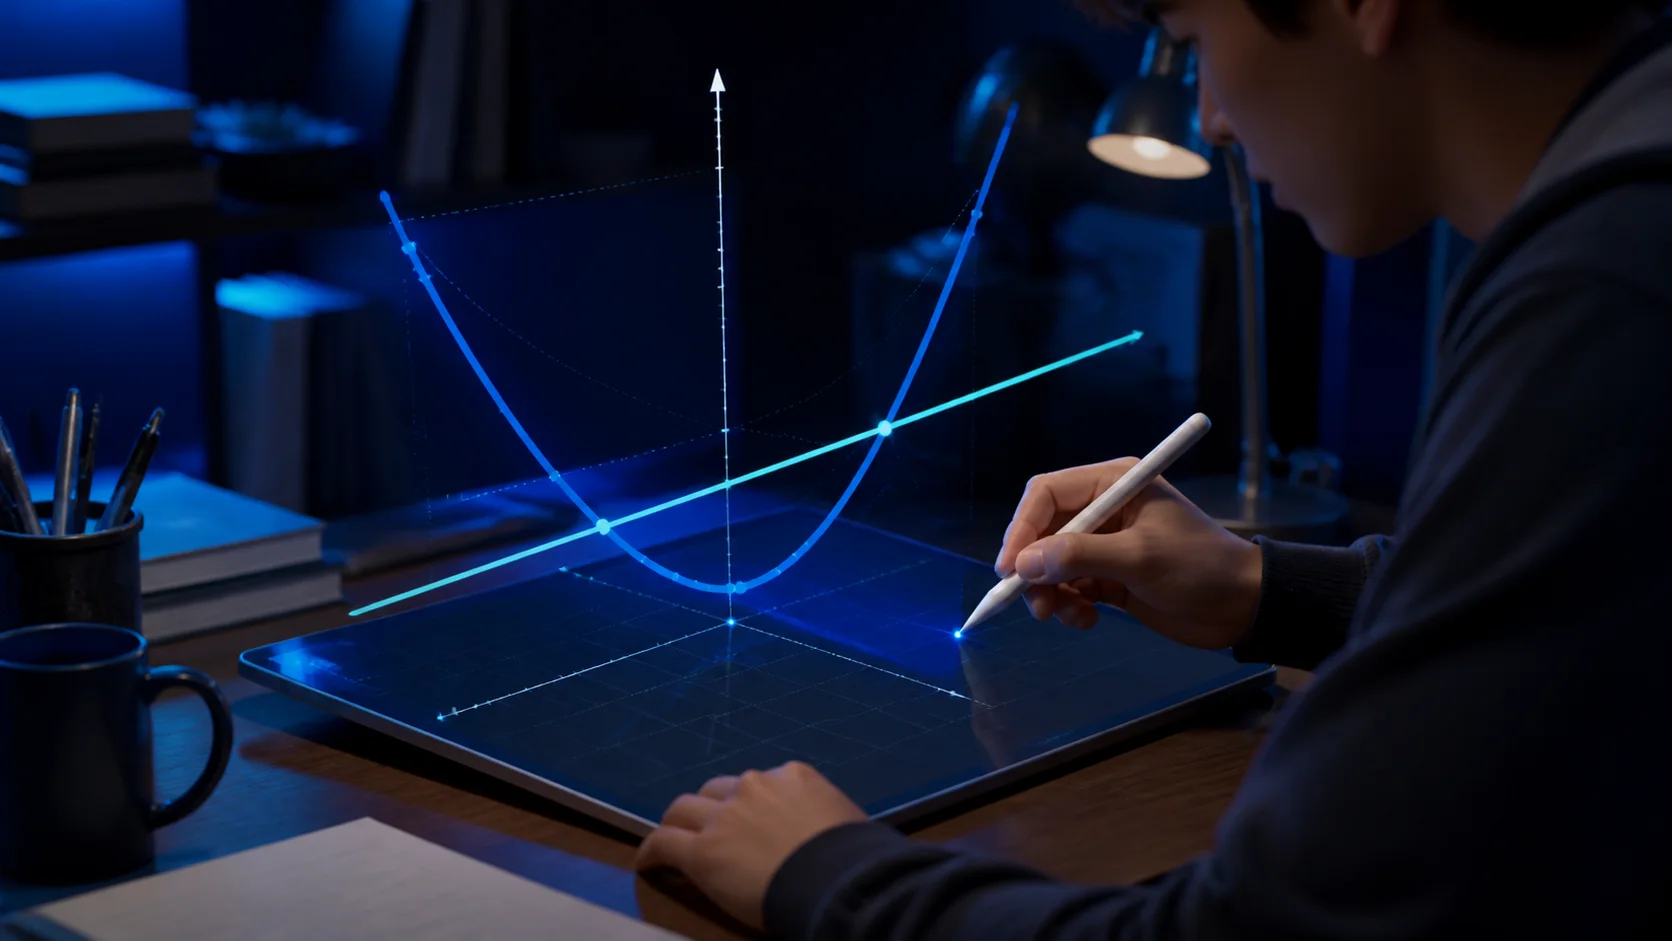
Some algebra only clicks when you see the curve. Eqora can generate graph artifacts from tutoring so intercepts, slope, and transformations become visible.
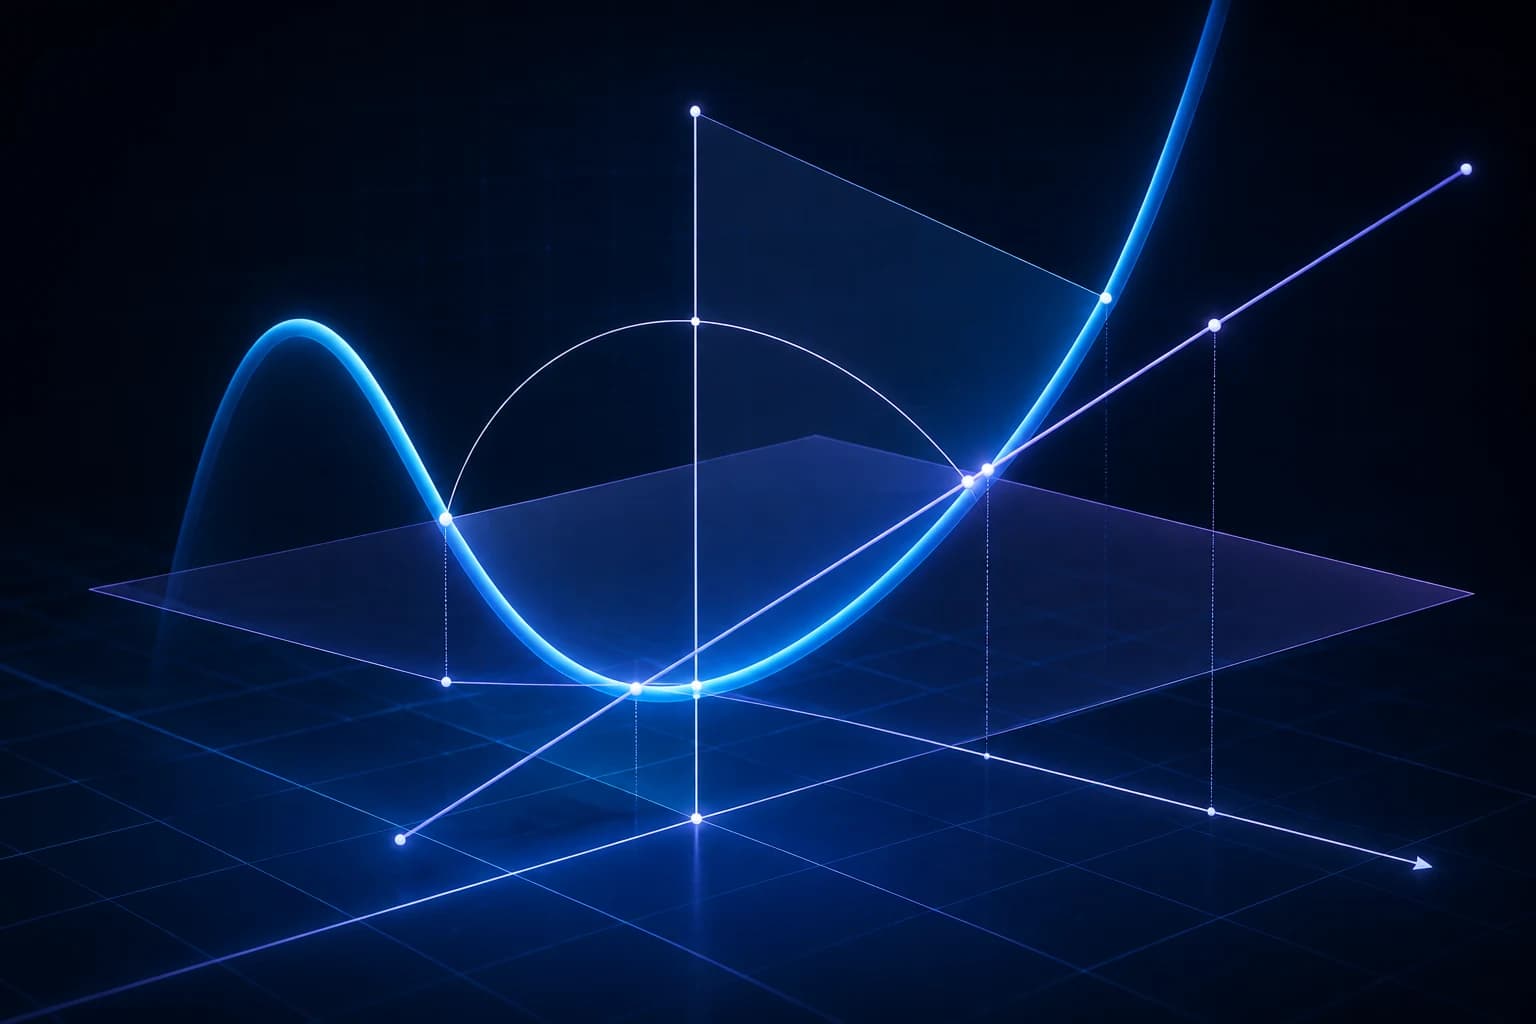

Good moments to graph
Use a graph when comparing two functions, checking roots, or understanding how a parameter shift moves a curve.
Still do the algebra
A graph supports intuition; exams still ask for exact algebraic work. Use both.
Choose a window that tells the truth
A graph can look flat, linear, or empty when the viewing window hides its important behavior. Identify the expected domain, intercepts, turning points, asymptotes, or scale before interpreting the picture. Zooming should answer a question, not merely make the curve fill the screen.
Compare the same function in two windows when behavior seems surprising. A local view may show tangent behavior while a wider view reveals end behavior. Record the axis scale so a steep-looking line is not mistaken for a large rate only because the axes use different units.
- Check the x- and y-axis scales
- Mark the domain relevant to the problem
- Look for cropped intercepts or turning points
- Treat apparent intersections as estimates until solved
Read features and connect them to algebra
Do more than identify the overall shape. Match roots to factors, y-intercepts to constant terms, turning points to changes in direction, and intersections to simultaneous solutions. Ask which algebraic feature creates each visible behavior.
For transformations, change one parameter and predict the movement before displaying the new curve. Write the prediction in words and symbols, then use the graph as feedback. This makes the visual part of the reasoning rather than a decorative final check.
Investigate disagreement between graph and work
When the graph and algebra appear to disagree, first check the entered expression and parentheses. Then inspect the viewing window, domain restrictions, approximate plotting, and whether the algebra introduced or lost a solution.
Use the disagreement as a diagnostic. Solve key points exactly, substitute them into the original expression, and compare with the plotted estimate. Keep the exact algebra when the question asks for proof or an exact value.
A graph is evidence about behavior. It is not a substitute for exact reasoning when exact reasoning is required.
Put it into practice now
Choose one problem from your current homework or review set. Attempt it before opening Eqora, then use the app only at the point where your own reasoning stops.
- State what the problem is asking before you solve it
- Identify the first step you cannot justify
- Ask Eqora one focused follow-up about that step
- Finish with a similar problem and no solution in view
The session is complete when the method is clearer, not simply when the worksheet has one more answer.